Nano Banana Pro 🍌🍌 助力「管理科学」论文绘图!⚓︎
约 2528 个字 5 张图片 预计阅读时间 8 分钟 总阅读量 次
这个事儿的起因是赖床上刷手机的时候看到了Datawhale发的一个公众号推文,大意是用大模型 + Nano banana Pro + 对成图微调或矢量化,实现定制化地生成论文内容图片(流程、算法、结构、大意等等)。很吸引我的是作者打磨出的这一整套框架:
- “逻辑构建(The Architect)”
- “视觉渲染(The Renderer)”
两个独立且互补的框架,都可以由AI进行,人负责在中间控制并检验、核对、验收,在检查发现错误的时候及时去微调,或者回滚到原先比较满意的部分。
于是我突然想到去年末到今年初,我在写Paper的时候也遇到类似的问题,当时用 PPT 抠示意图画了倒也挺久,就想或许我也可以由AI帮我做一点工作,我好中选好,优势互补,倒也是个不错的事,于是说干就干,我依然严格遵循作者的框架,但是做了一点微小、定制化的提示词工程。
「仿」逻辑构建:与大模型对话⚓︎
第一步就是复制下面的提示词,在最后空白部分,粘贴你想要让大模型帮你绘制的论文内容,你最好在一开始就有选择地把论文重点部分截取出来,比如你想要它绘制某种「运营模式」的示意图,或者「创新点」, 你就重点需要把文中描述这种模式的文本、文章场景、文章创新点的文本给复制提取出来,不要一股脑把整个文章所有内容都在这一步喂给AI,否则它抓不住重点,也会错过你想它表达的图的含义。
下面的提示词组织完毕后,喂给你常用的对话大模型(更推荐同一个提示词喂给不同的模型,比如 Qwen 让他输出一份, Gemini 3 让他输出一份, GPT 5 让他输出一份,这样就有了3版提示词,方便对比效果)。我这里更推荐 Gemini3.0 ,Qwen 这类,测试下来感觉 Gemini 更好,大模型会按照你上面的格式输出。
这个输出就是AI理解过的要点指南。
# Role
你是一位 **Management Science / Operations Research (MS/OR)** 顶刊(如 *Management Science*, *Operations Research*, *POMS*, *Transportation Science*)的**系统可视化架构师**。你的核心能力是将复杂的数学模型、供应链结构或博弈逻辑转化为**具体的、拓扑化的、系统级的视觉指令**。

# Objective
阅读我提供的论文摘要/方法论内容,输出一份 **[VISUAL SCHEMA]**。这份 Schema 将被直接发送给 AI 绘图模型,因此必须使用**具有物理实体的系统描述**(而非抽象的数学概念)。

# Phase 1: Layout Strategy Selector (关键步骤:系统拓扑决策)
在生成 Schema 之前,请先分析论文的模型特性,从以下**管理科学布局原型**中选择最合适的一个(或组合):

1.  **Echelon/Flow Structure**: 左→右或上→下流向 (适合 Supply Chain, Manufacturing Process, Logistics Flow)。
2.  **Network Topology**: 节点与连线构成的网络图 (适合 Transportation, Routing Problem, Social Networks, Graph Theory)。
3.  **Hierarchical/Decision Stack**: 金字塔式或分层堆叠 (适合 Bilevel Optimization, Strategic/Tactical/Operational Planning)。
4.  **Game/Interaction Arena**: 对称或非对称的对抗/交互结构 (适合 Game Theory, Two-sided Markets, Platform Economy)。
5.  **Closed-Loop/System Dynamics**: 包含反馈回路的循环结构 (适合 Closed-loop Supply Chain, Inventory Management, Sustainability)。

# Phase 2: Schema Generation Rules
1.  **Entity Materialization**: 必须将抽象变量转化为具象符号。例如:
    *   *Inventory $I$* -> 堆叠的立方体或托盘 (Stacked cubes/Pallets).
    *   *Node $i$* -> 具体的设施图标 (Warehouse, Factory, Server).
    *   *Vehicle/Agent* -> 简化的运输工具或小人 (Truck, Drone, Abstract Avatar).
    *   *Uncertainty/Demand* -> 波动曲线或随机散点 (Wavy lines, Stochastic clouds).
2.  **Logic Logic**: 使用标准的运筹学视觉语言。实线代表实体流动(物流),虚线代表信息流动(信息流/决策流),双向箭头代表交互。
3.  **Constraint Boundaries**: 如果有约束条件(Constraints),使用虚线框或阴影区域将相关节点包裹起来。

# Output Format (The Golden Schema)
请严格遵守以下 Markdown 结构输出:

---BEGIN PROMPT---

[Style & Meta-Instructions]
Professional scientific diagram for Management Science, clean vector style, isometric or flat 2.5D view. Minimalist, academic, high contrast. White background. NOT artistic, NOT painterly. Precise geometric shapes.

[LAYOUT CONFIGURATION]
* **Selected Layout**: [例如:Multi-Echelon Supply Chain Network]
* **Composition Logic**: [例如:Three distinct layers (Supplier -> Manufacturer -> Retailer) connected by logistic arrows]
* **Color Palette**: Corporate & Academic (Navy Blue, Steel Grey, Brick Red for highlights, Teal for information flow).

[ZONE 1: LOCATION - LABEL]
* **Container**: [例如:Left Region - Upstream Suppliers]
* **Visual Structure**: [具体元素, e.g., A cluster of 3 isometric factory icons, represented as simplified hexagonal buildings]
* **Key Text Labels**: "[Supplier i]", "[Capacity K]"

[ZONE 2: LOCATION - LABEL]
* **Container**: [例如:Central Region - The Hub/Manufacturer]
* **Visual Structure**: [具体元素, e.g., A large central distribution center with internal conveyor belt graphics. Beside it, a bar chart symbol representing Inventory Level]
* **Key Text Labels**: "[Plant]", "[Production x(t)]", "[Inventory I(t)]"

[ZONE 3: LOCATION - LABEL]
... (Add Zone 4/5 based on layout, e.g., Downstream Retailers or Demand Market)

[CONNECTIONS & FLOWS]
1.  [物理流/物流, e.g., Solid thick arrows pointing from Zone 1 to Zone 2, referencing "Raw Material Flow"]
2.  [信息流/决策, e.g., Dashed thin curved arrows flowing from Zone 3 back to Zone 2, referencing "Demand Information Sharing"]
3.  [数学关系, e.g., A bracket combining Zone 2 and 3 labeled "Joint Optimization"]

---END PROMPT---

# Input Data
[在此处粘贴你的论文内容]
</text>
「仿」视觉渲染:与文生图大模型交流⚓︎
把上面的输出,与下面这段控制生成图片格式的提示词结合在一起,你会得到一份超长超长的文本,把整个文本丢给 Nano Banana Pro!等待它的输出即可。
**Style Reference & Execution Instructions (MS/OR Edition):**

1.  **Art Style (TikZ/Visio Professional Aesthetic):**
    Generate a **high-fidelity scientific schematic diagram** suitable for top-tier Management Science & Operations Research journals (e.g., *Management Science*, *Operations Research*, *POMS*).
    *   **Visuals:** Precision vector graphics mimicking **LaTeX TikZ** or high-end **Microsoft Visio** charts. Use isometric (2.5D) elements for physical facilities (warehouses, plants) and flat 2D lines for logical flows.
    *   **Color Palette:** Use a **"Corporate & Industrial"** palette.
        *   **Primary:** Navy Blue (Entities), Steel Grey (Structure).
        *   **Secondary:** Brick Red or Burnt Orange (Highlights/Risks), Teal (Information).
        *   *Avoid:* Neon colors, overly soft pastel gradients, or "startup tech" aesthetics.
    *   **Layout:** Strictly follow the spatial arrangement defined below. The logic of the flow (left-to-right or top-down) must be preserved to represent the sequence of decisions or logistics.
    *   **Vibe:** **Analytical, Industrial, Systemic.** Minimalist and high-contrast. NOT artistic, NOT painterly, NOT abstract data art, NO cinematic lighting.

2.  **CRITICAL TEXT CONSTRAINTS (Read Carefully):**
    *   **DO NOT render meta-labels:** Do not write instructional words like "ZONE 1", "Echelon 2", "Input Data", or "Container" inside the image. These are structural instructions for YOU.
    *   **ONLY render "Key Text Labels":** Only text inside double quotes (e.g., "[Retailer]", "[Inventory]") listed under "Key Text Labels" may appear.
    *   **Font Style:** Use a clean font that mimics **Computer Modern (LaTeX font)** or **Arial**, making it look like a rigorous mathematical model diagram. Avoid decorative or handwritten fonts.

3.  **Visual Schema Execution:**
    Translate the following structural blueprint into the final image, ensuring clear distinction between **Physical Flows** (solid lines/arrows) and **Information Flows** (dashed lines/arrows) if specified:
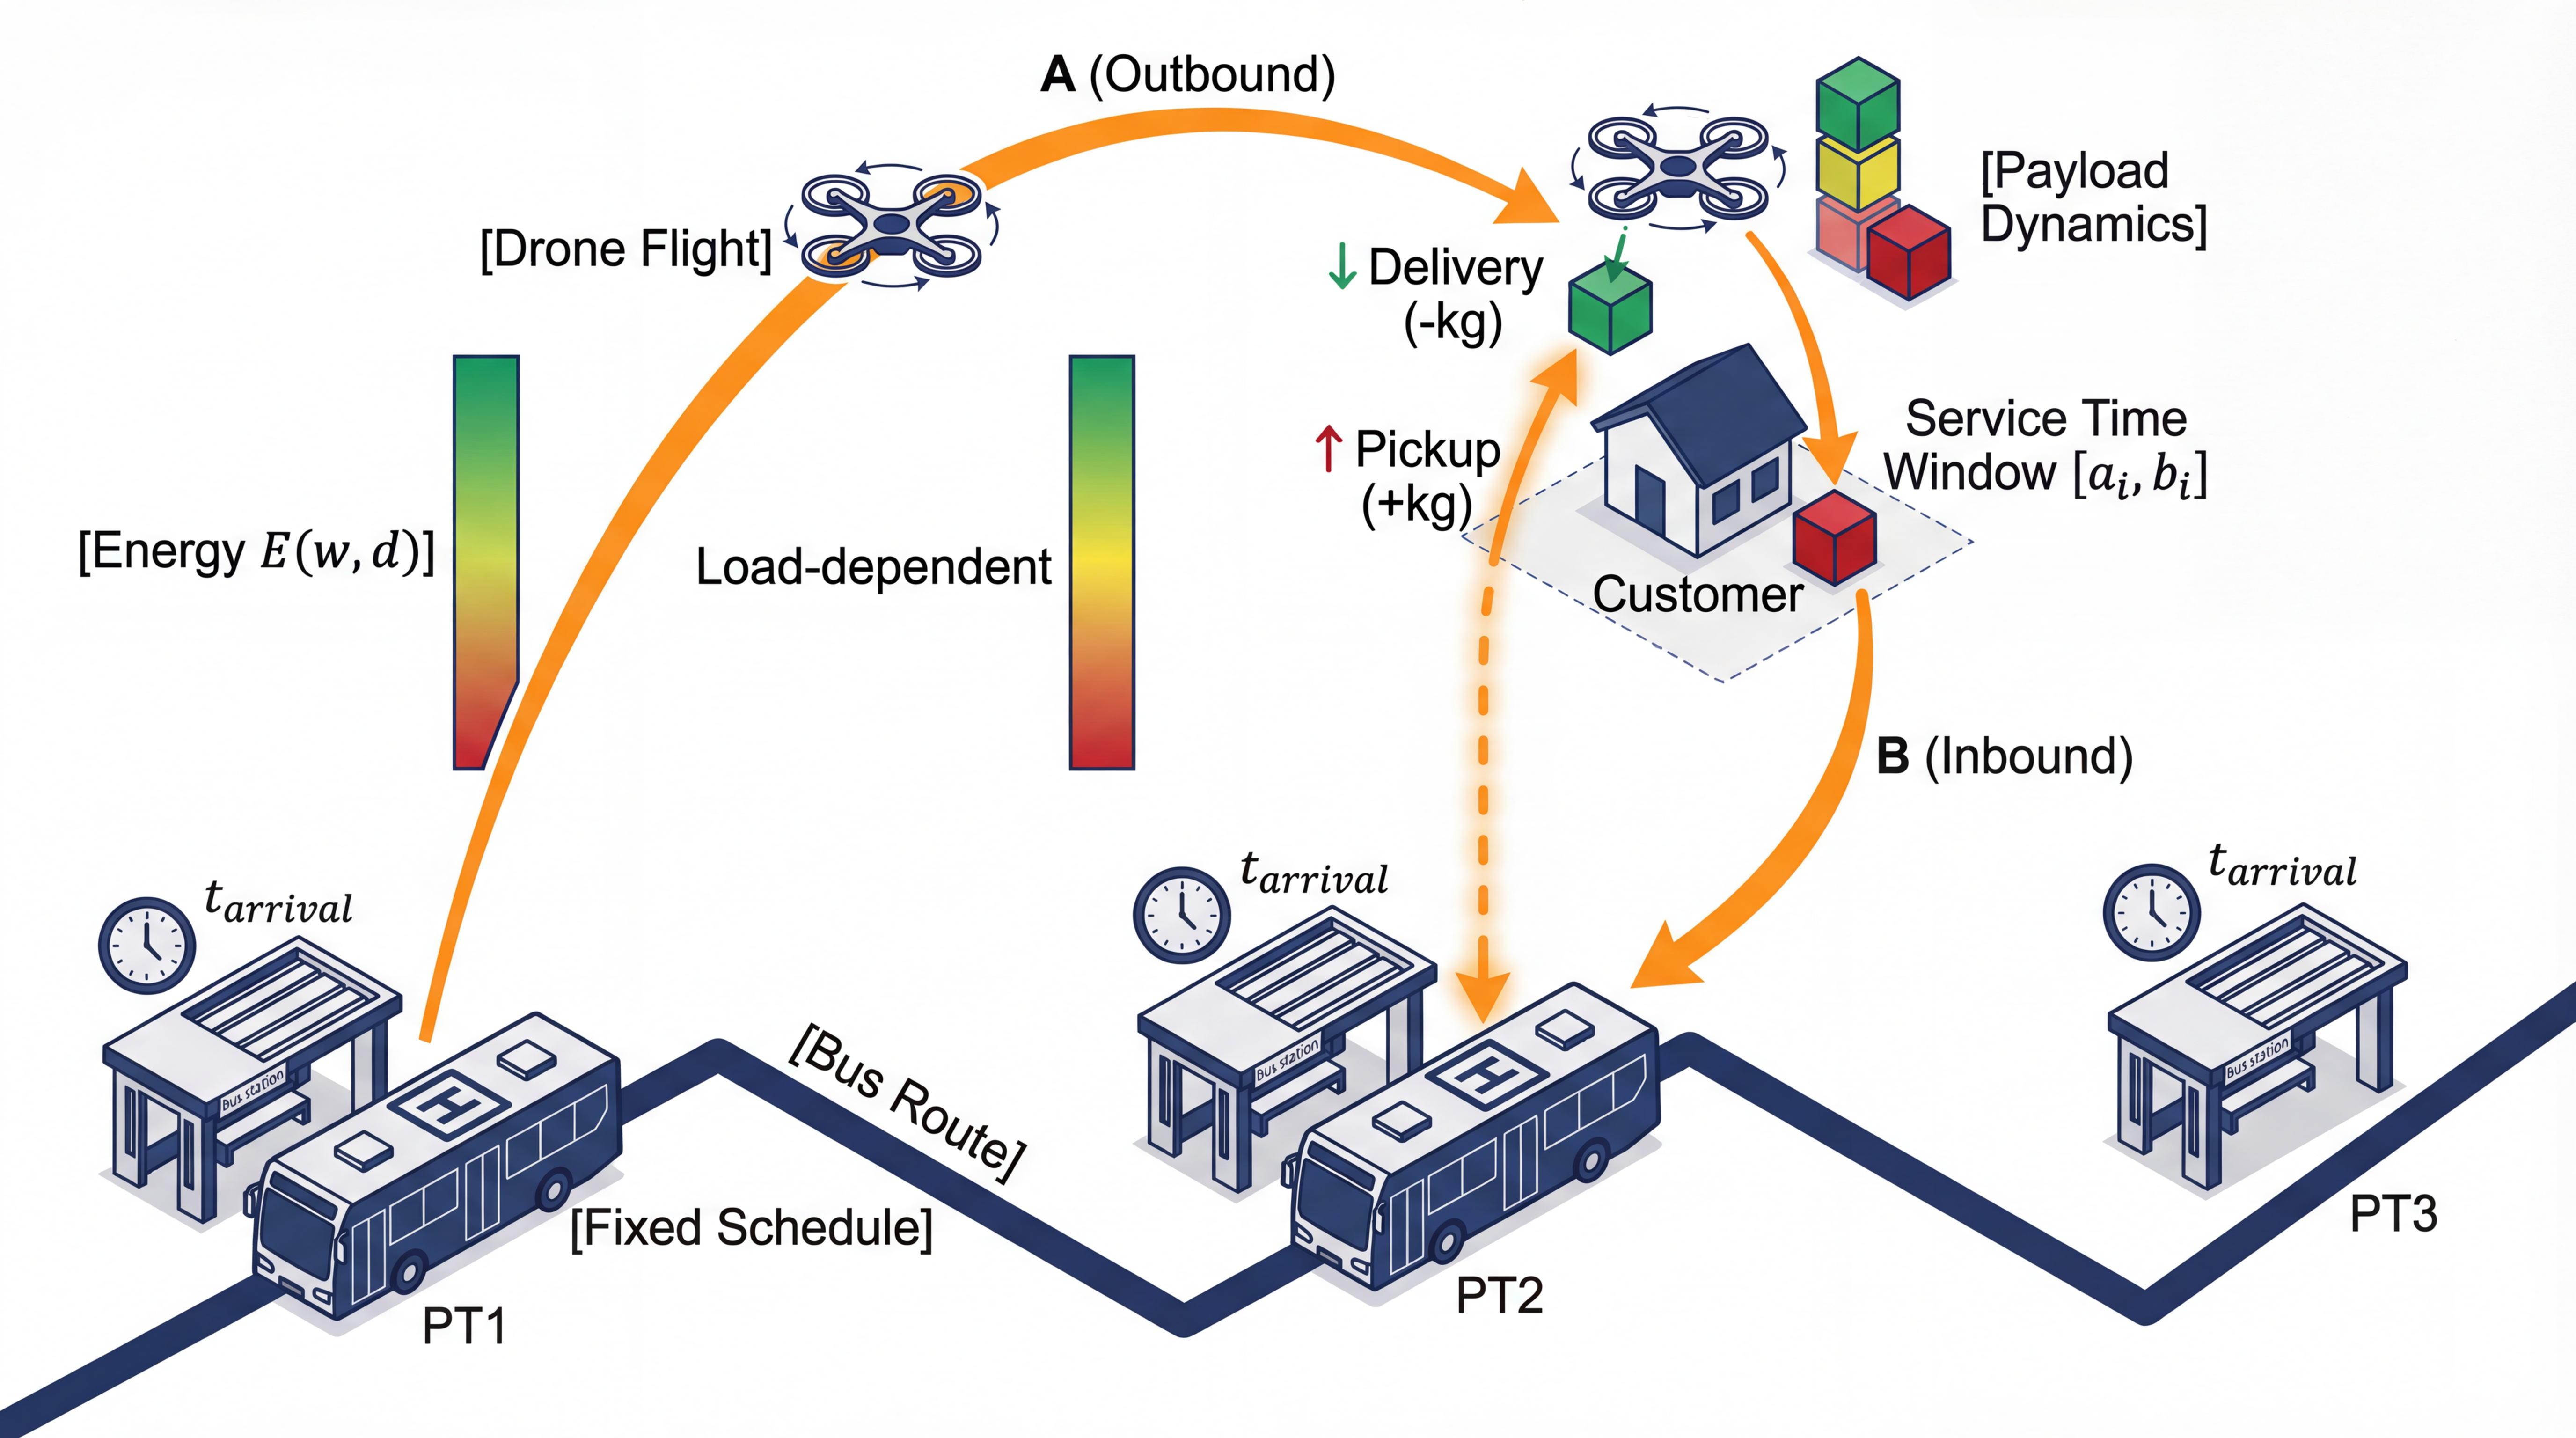
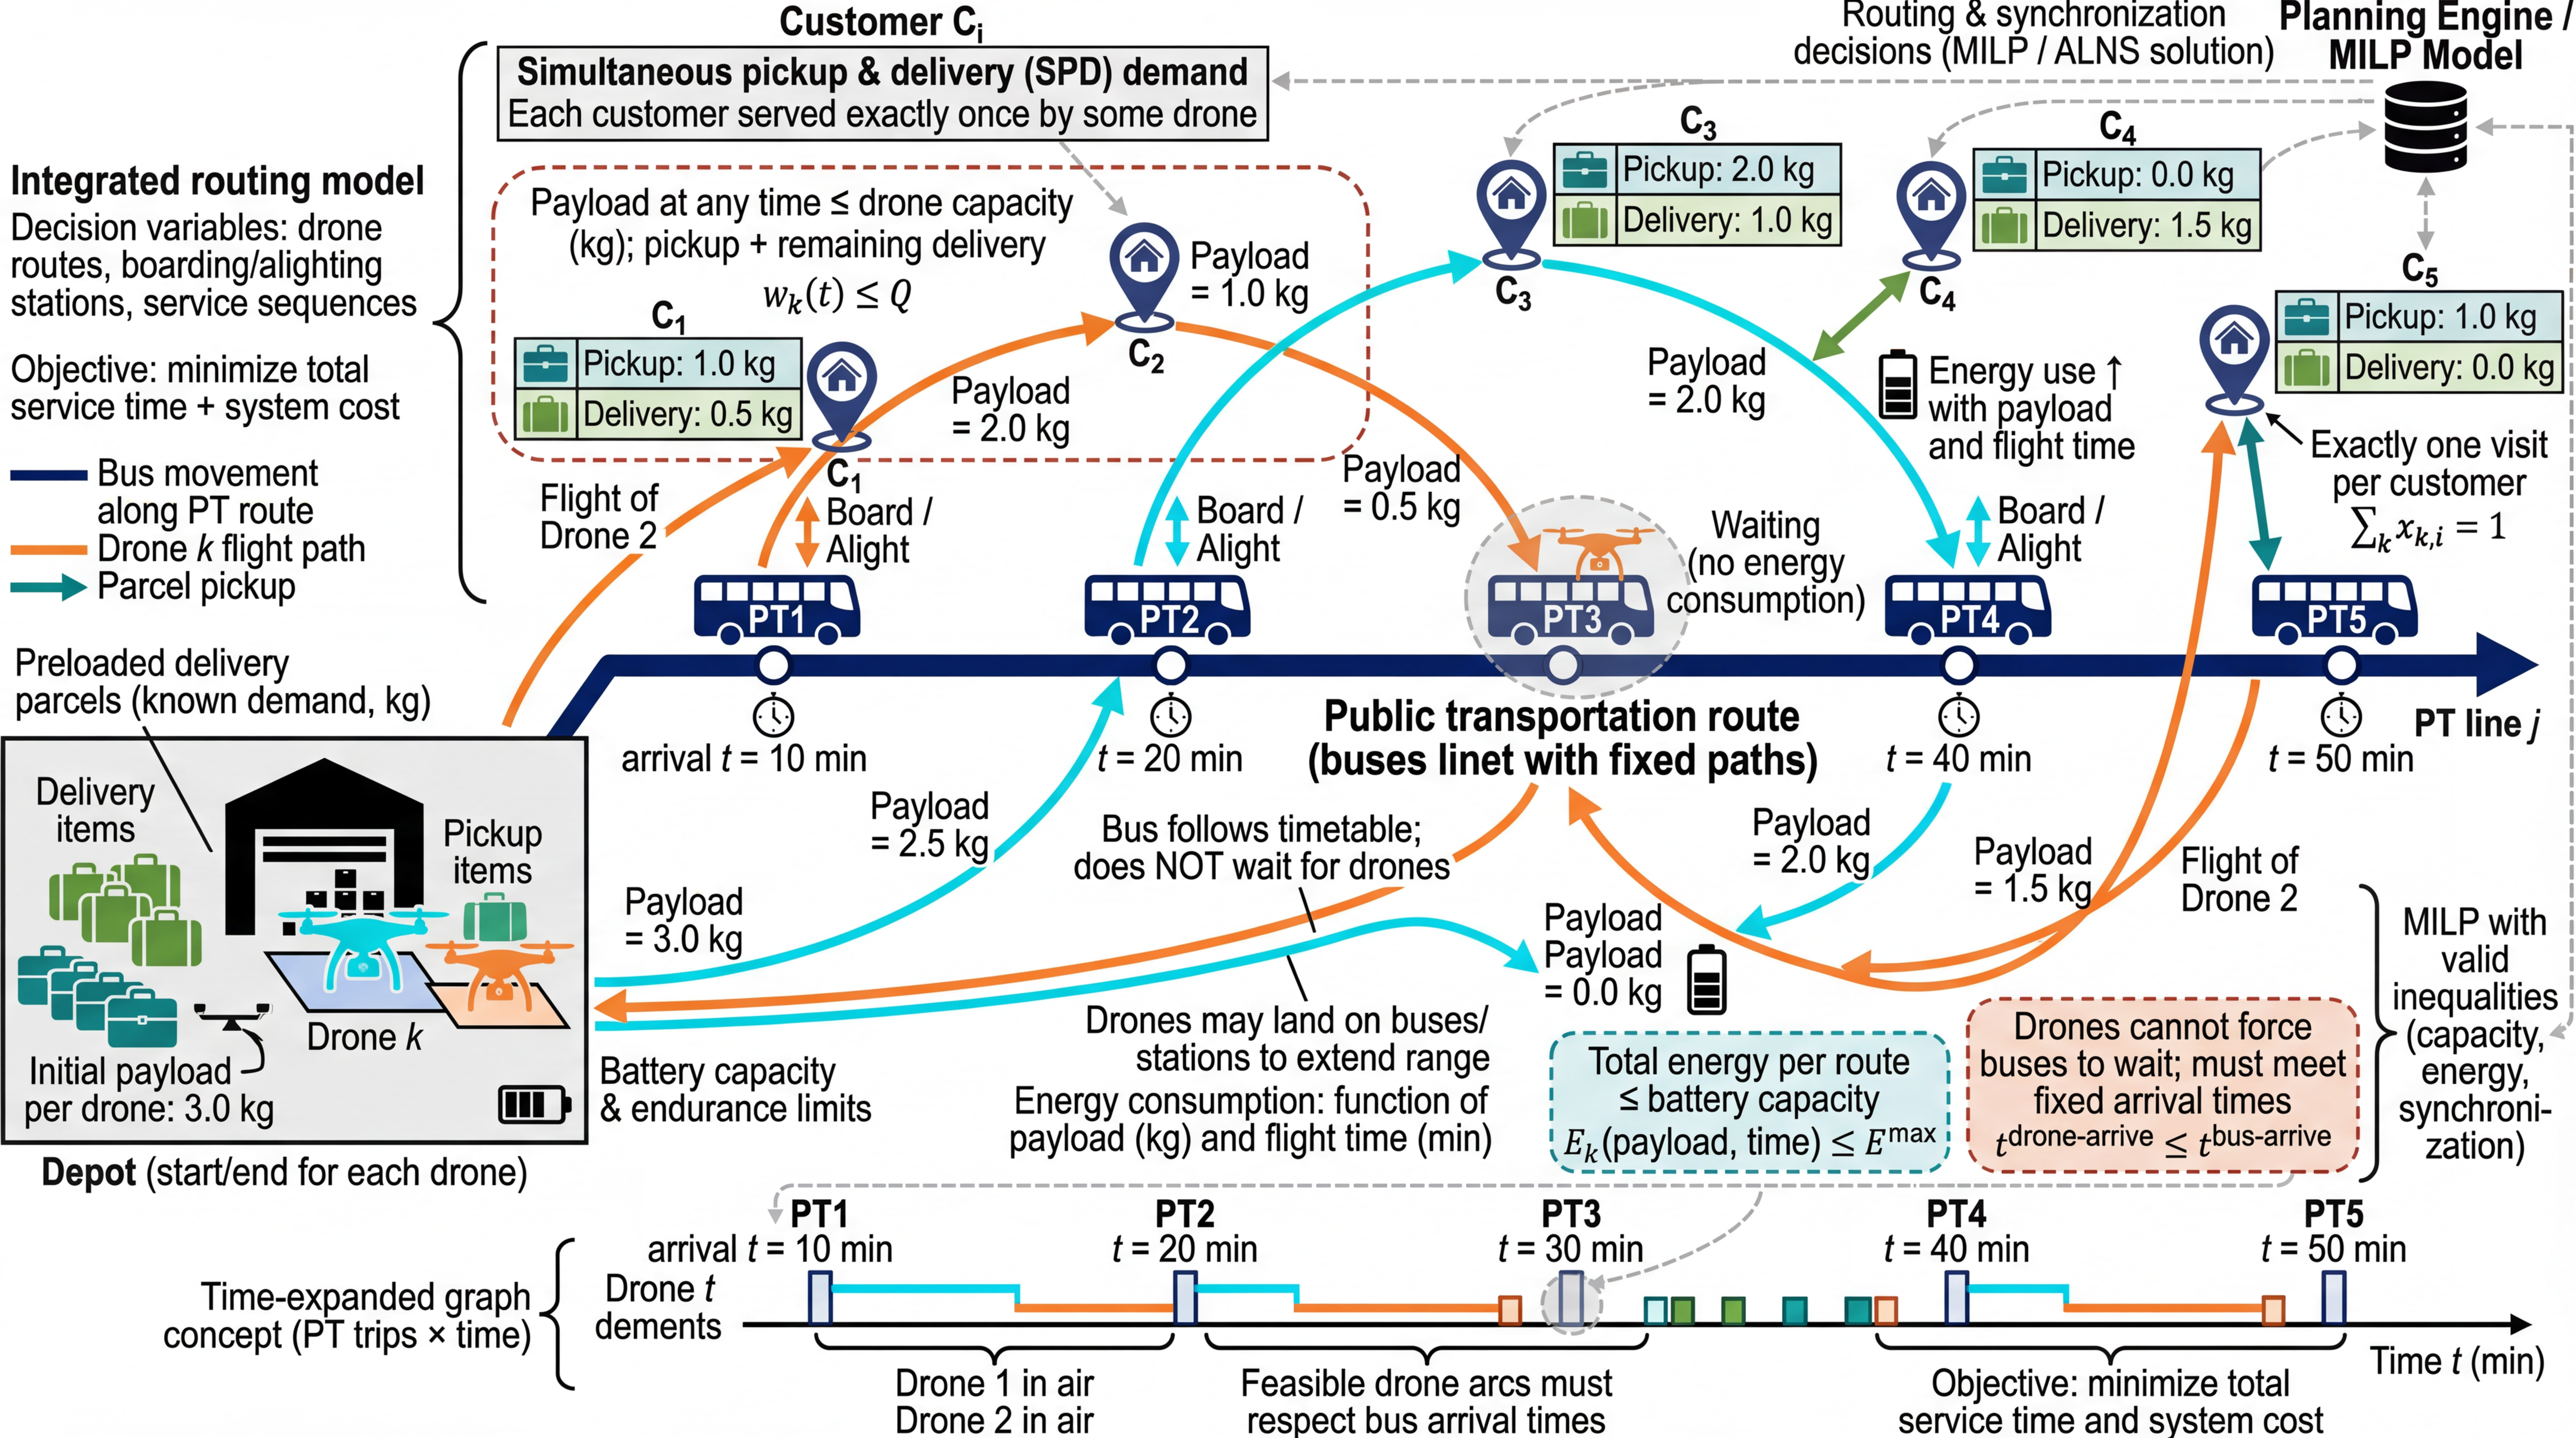
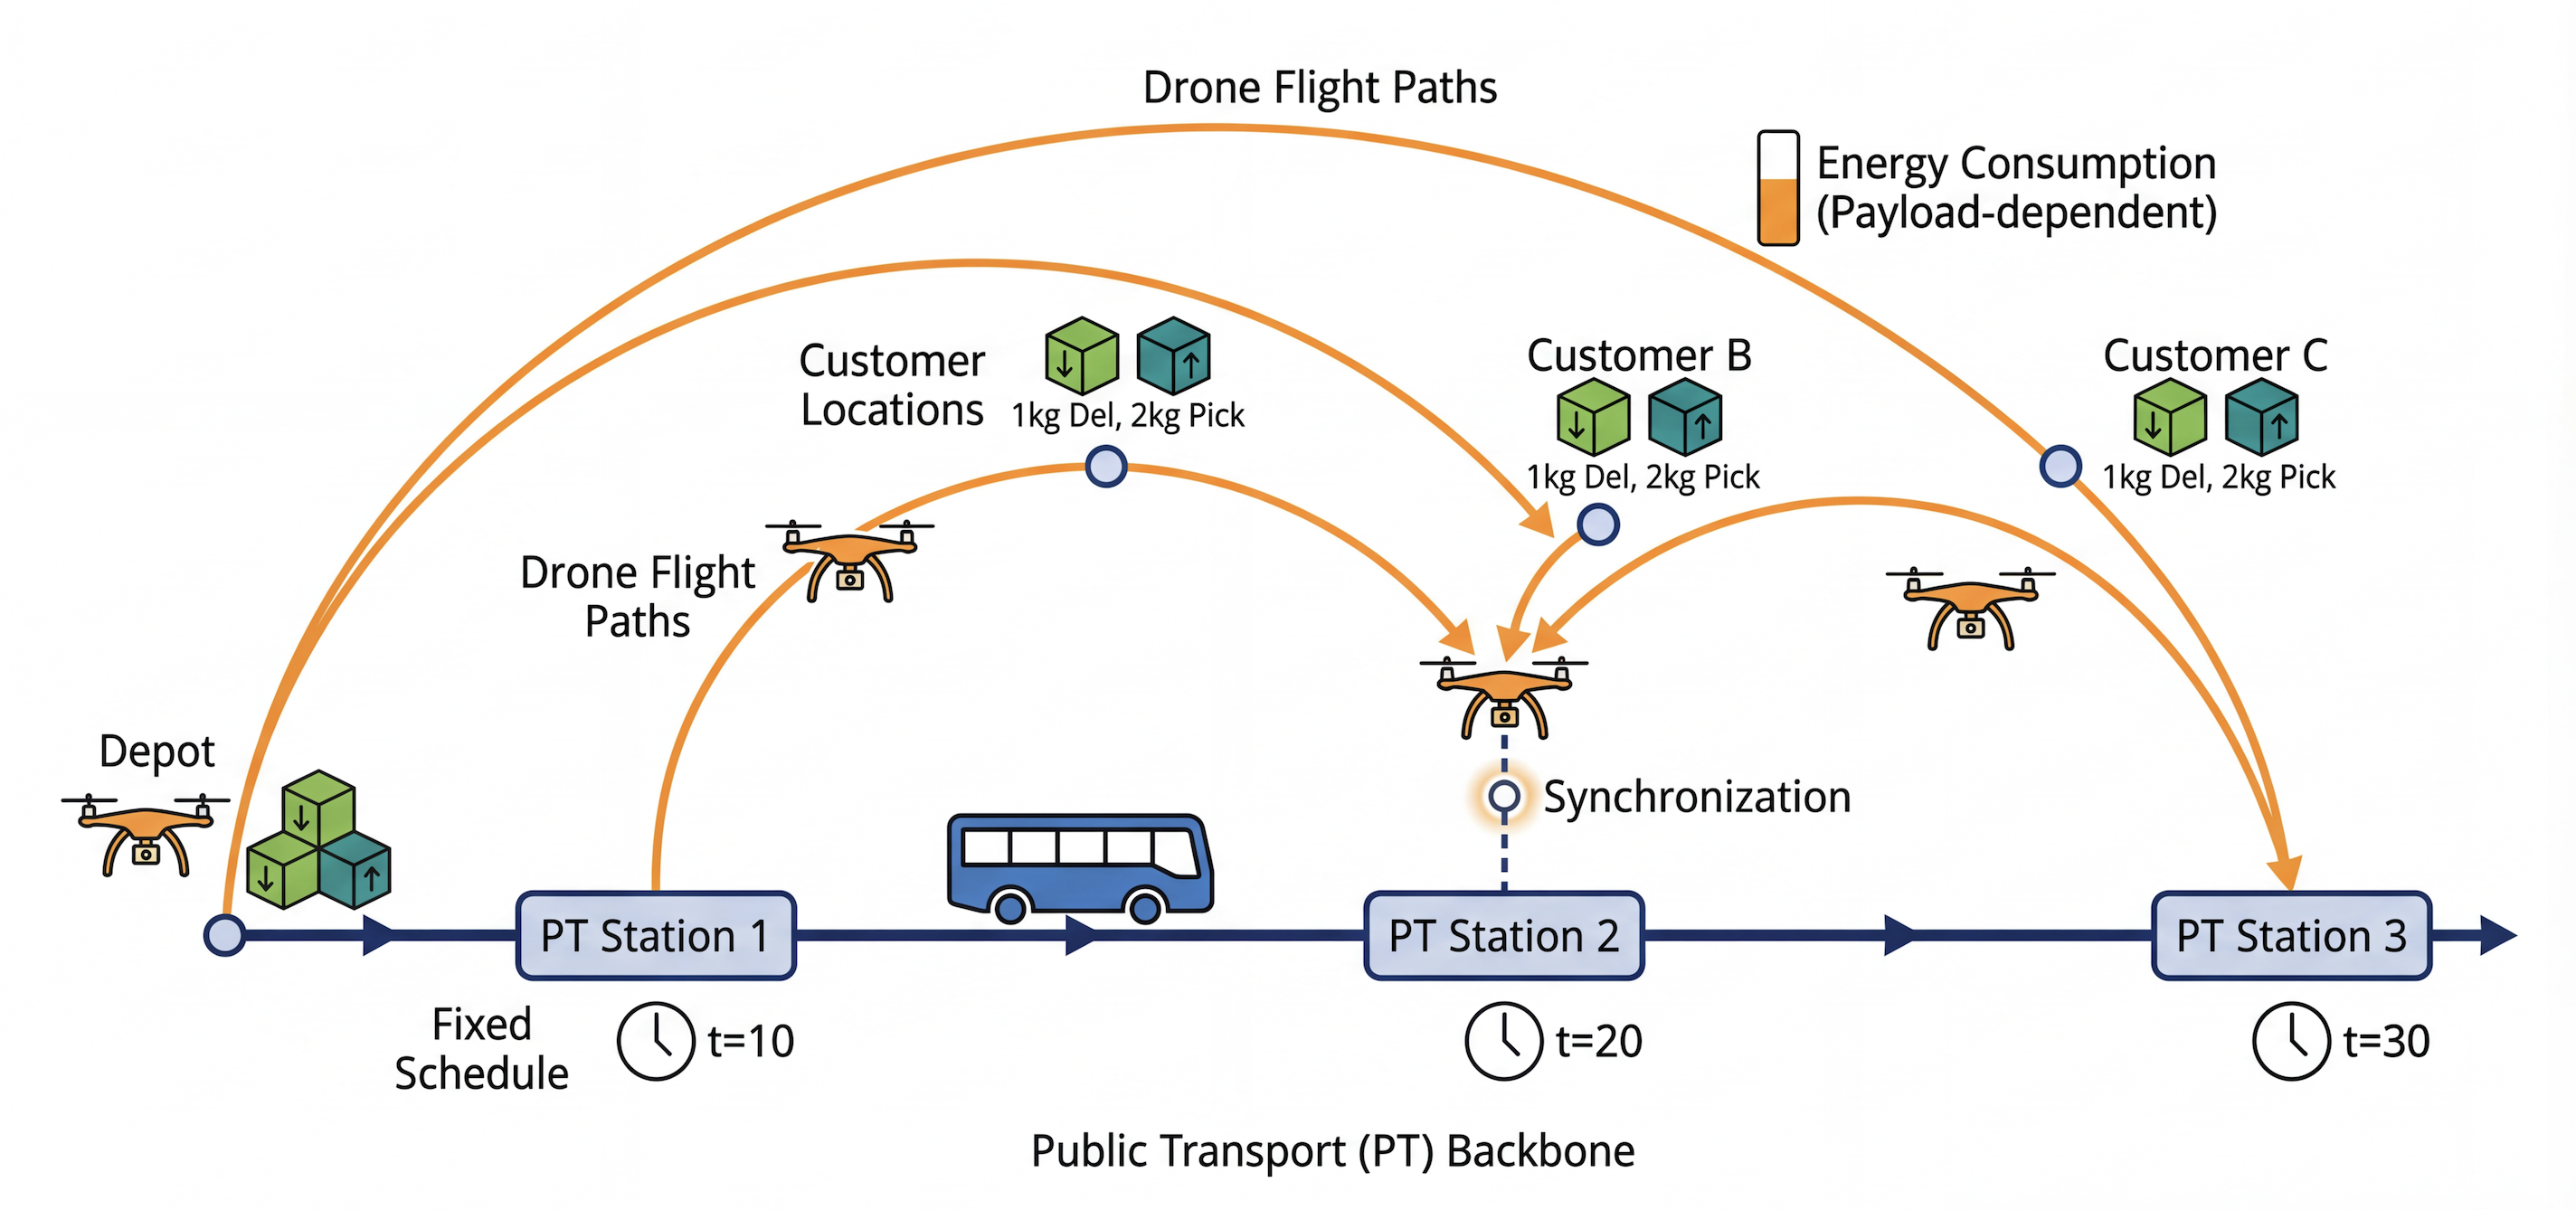
看看效果图。说实话,比我整的好看多了...(文章就不透露了)
「你不该止步于此」:严谨、严格、反复的检查!!⚓︎
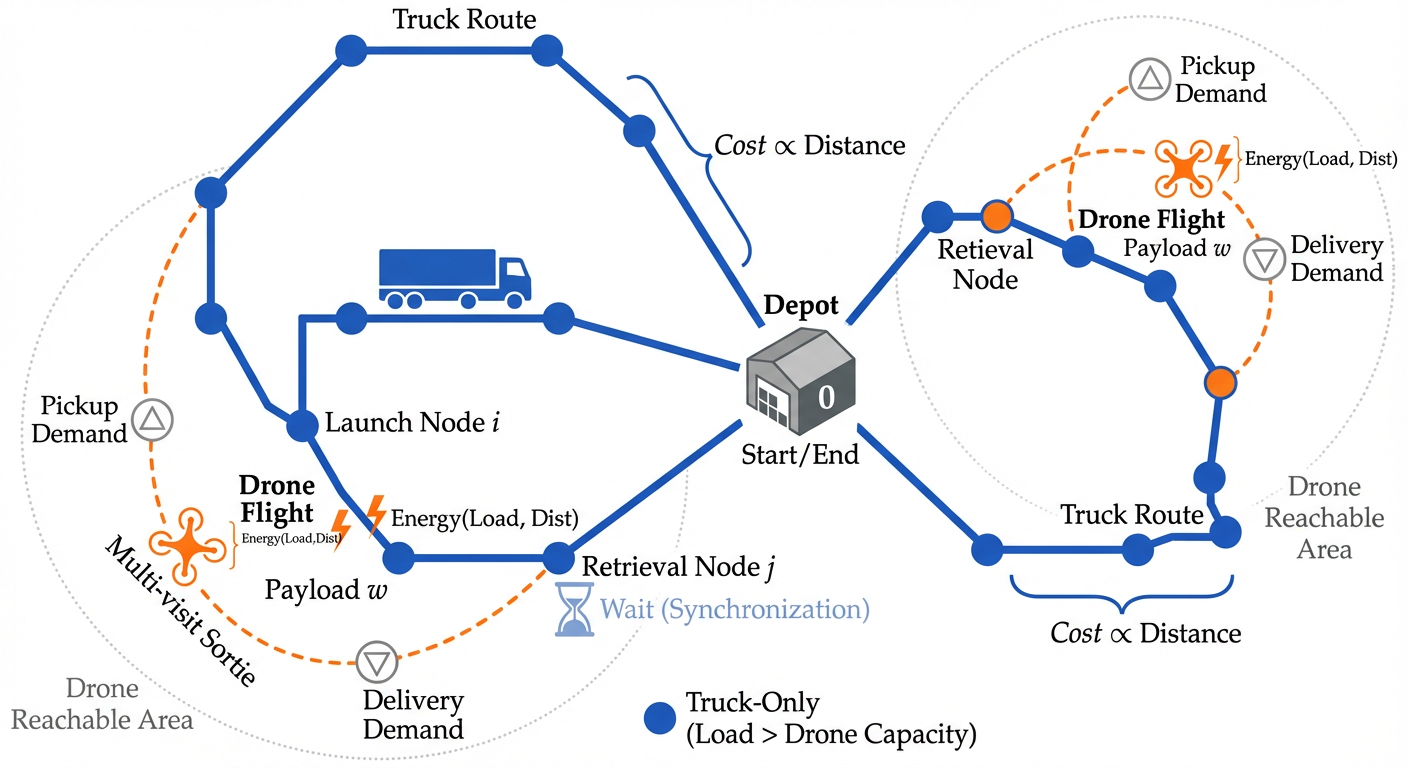
但是这一套操作不是万能的,甚至可以说它的质量是比较不稳定的,仔细看你会发现,其实图有的地方画错了,比如Launch Node和 Retrieval位置标错了,这需要你自己对图片进行微调。
在实际操作的时候可以放到 PS 里稍微微调一下。
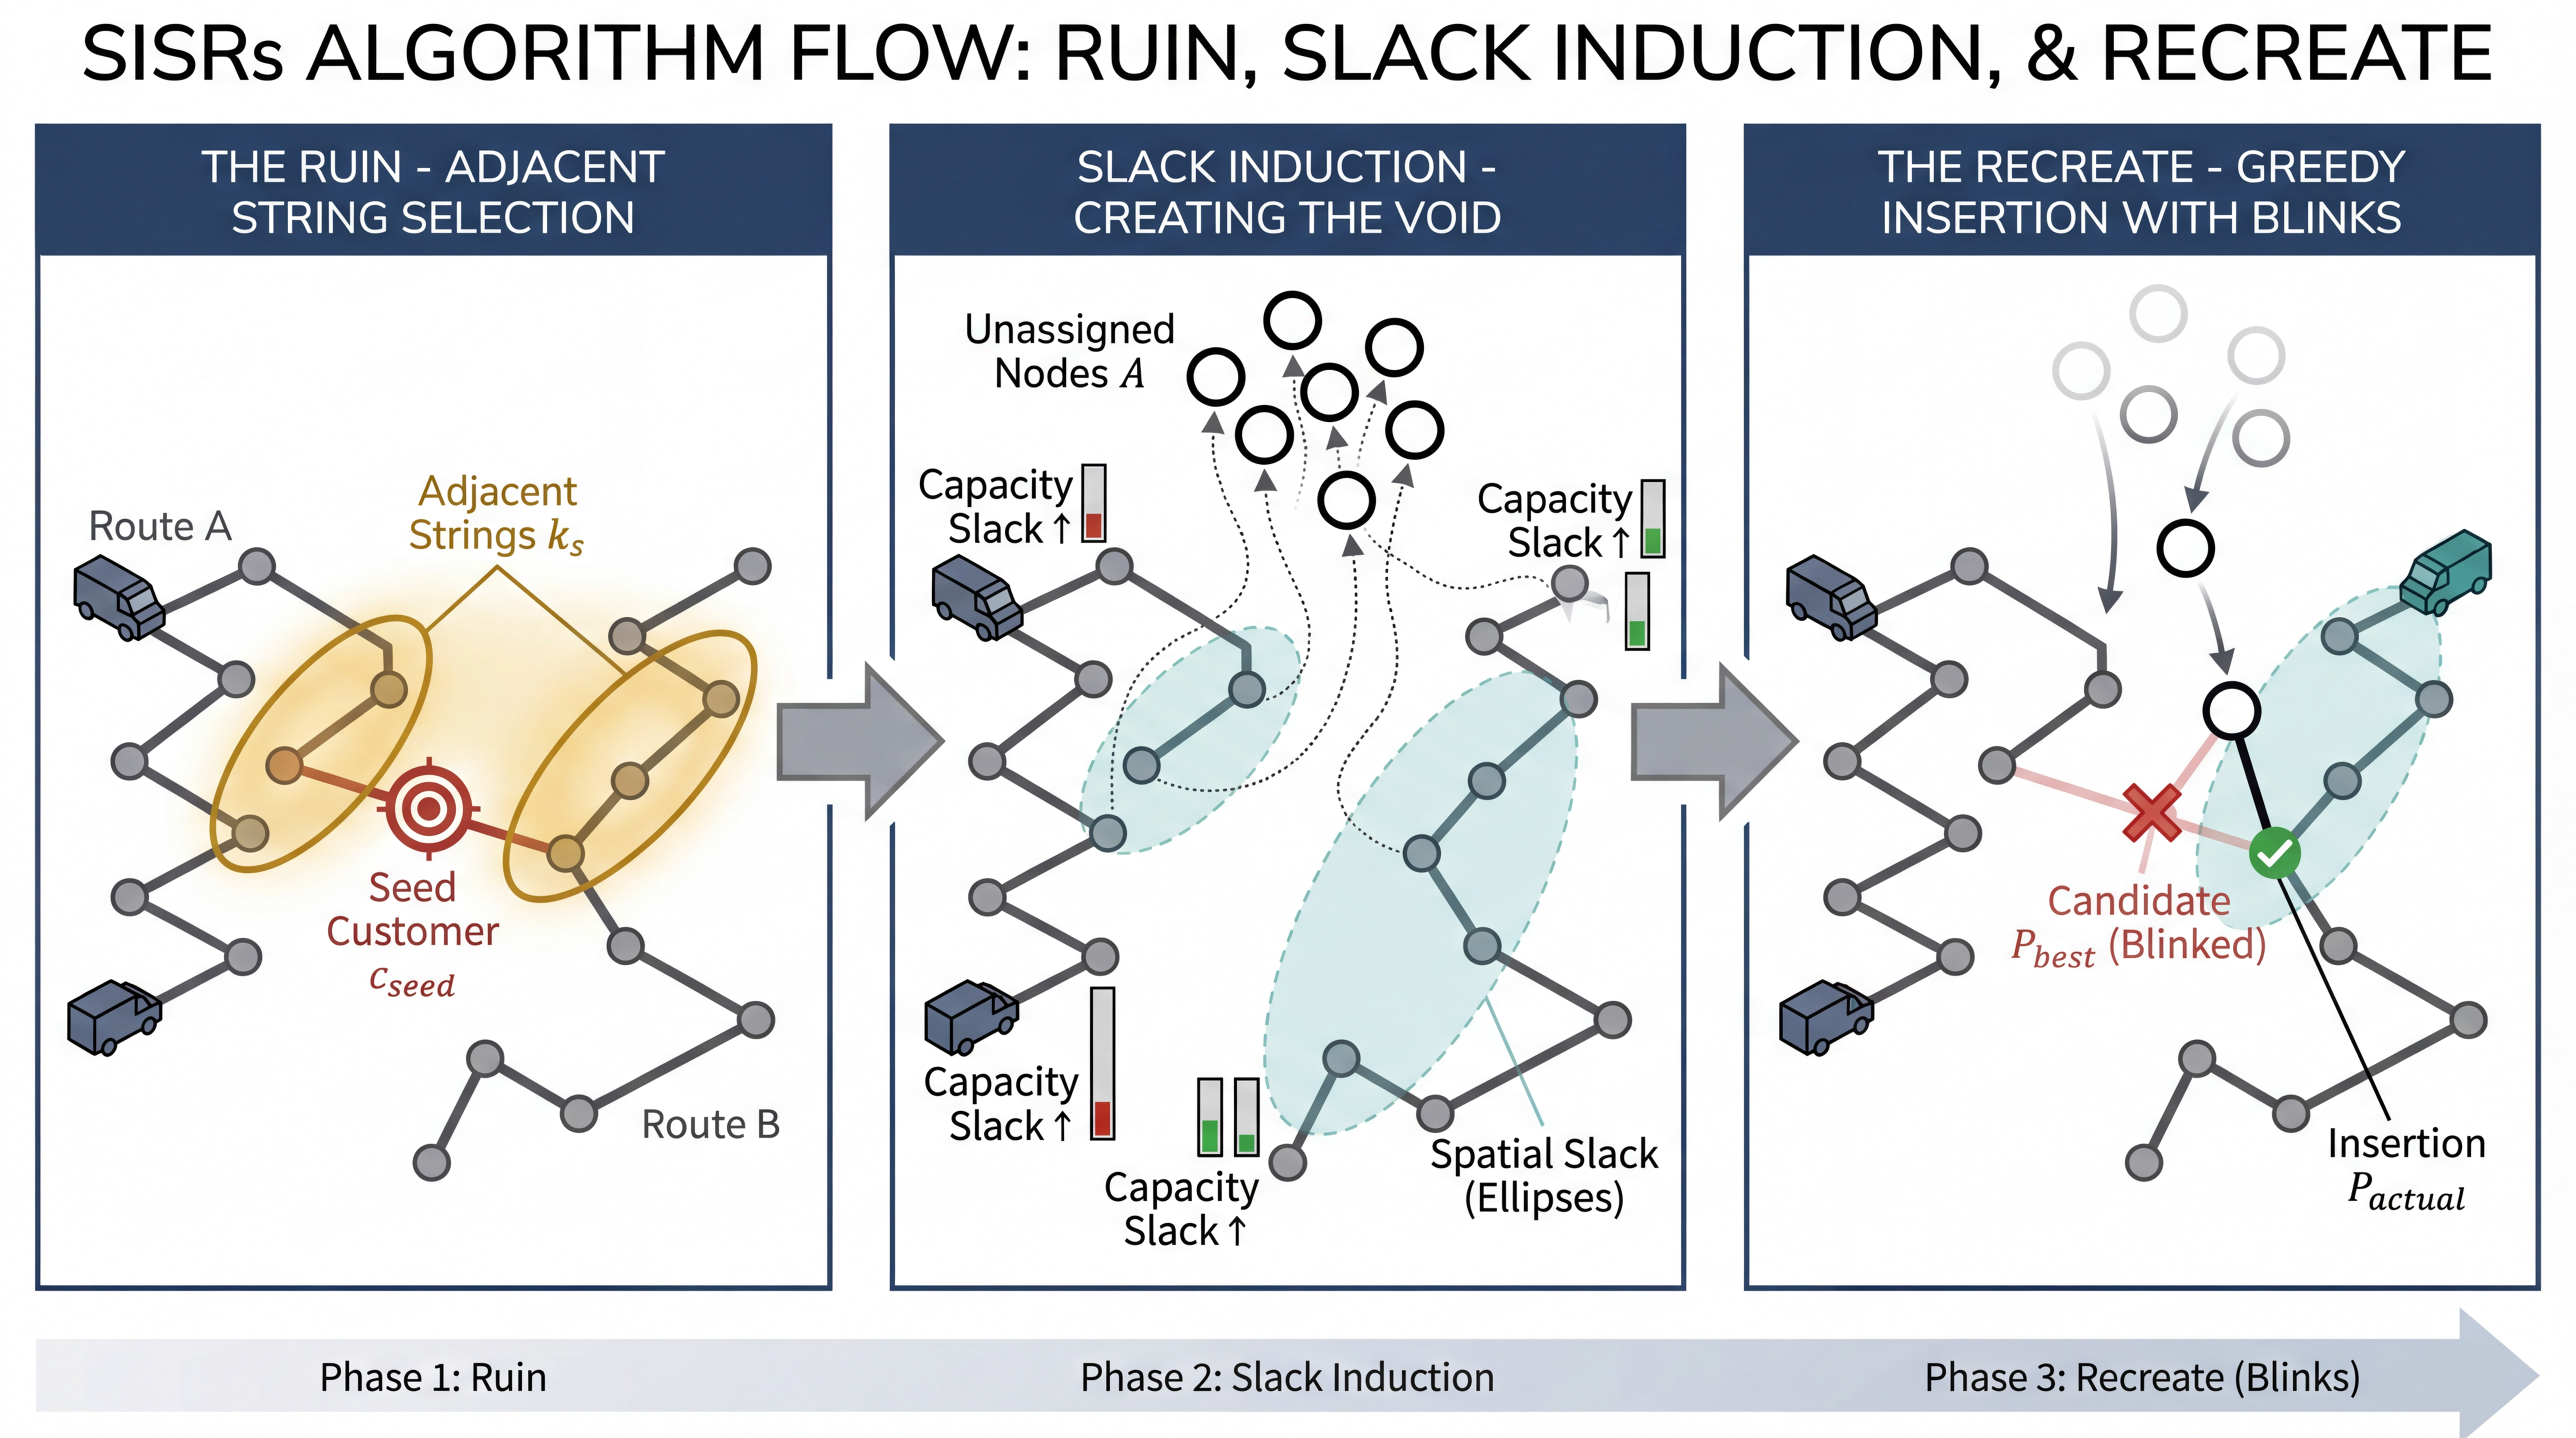
在算法生成上,效果也还不错,但是细究会发现还是有些不足:
事实上完整走完这个流程后我最大的收获是:
“严谨、严格的事后检查和修改”是非常重要的一环,因为平时科研示意图之所以我们繁琐,不是说我们真的做不好看(因为硬凑和怎么都能说得通),而在于需要反复核查细节,以确认强调的重点、保证信息的传递、直观而不臃肿,如果新增了什么小的标注,那么其他部分是否需要调整?是因为总有这种牵一发而动全身的修改,使得绘图的过程充满了微调和反复推倒、重做。
而用 AI 生成图不代表你不需要微调,一次就能交差了!真正可以做的事,是意识到自己能力的边界与AI能力的边界,始终保持大脑的活跃,始终知道什么时候“介入”到AI的创作中,什么时候让AI创造一切,自己进行验收,大胆地丢给它去生产、去创造、去生成创意,去改变你的工作流。
比如它有时候就会出现一些不符合预期的产出,文字描述太多,重点不突出:
或者展示不完全,但是勉强能当作示意图的:
在Datawhale的那个推文里,具体谈及了一些针对不符合预期的情况进行微调的小技巧,包括调整一开始的提示词、加入更多的引导,或者重新组织文本。那些思想同样适用于本文。
一些进阶(转载)⚓︎
为了进一步提升出图质量,我们可以结合人工介入和一些工具技巧:
- 人工介入微调 (Human-in-the-loop)
LLM 生成的 [VISUAL SCHEMA](Step 1 的结果)本质上是完全可编辑的。 你不需要反复“抽卡”来碰运气,直接修改 [VISUAL SCHEMA] 往往更快。例如,如果你不想要某个图标,直接在蓝图文本里把 Top Visual: A robot 改成 Top Visual: A brain icon;如果觉得颜色太花哨,直接在 Color Palette 里删掉多余的颜色。
- 提供参考图像
语言描述终究有其局限性,再精准的 Prompt 也难以完全复刻你脑海中特定的视觉张力或复杂的空间拓扑。因此,我们需要引入更直观的约束手段。
建立“科研审美库”与风格迁移:我强烈建议你在日常阅读顶刊论文时,建立一个私人的“科研审美库”,有意识地收集那些布局精妙、配色高级的插图。在实战中,如果你有一张目标风格的图片(甚至是你的手绘草稿),请直接上传给模型,并删除步骤二提示词中的通用 Art Style 描述,改为明确指令:“生成的 Figure 风格、布局特征和配色方案应严格参考我上传的图片”。这将迫使 AI 从“文生图”逻辑切换为更精准的“图生图”逻辑,从根本上解决布局失控的问题。
参数化控色:仅仅告诉 AI 使用 "Light Blue" 或 "Red" 是远远不够的,这往往会导致生成图带有廉价的“塑料感”。真正的专业级绘图需要“参数化控色”。 你可以利用取色工具从你的“审美库”中提取精准的 HEX 代码(如 #E1F5FE),并在 Prompt 中强制指定颜色。