Matplotlib相关
用matplotlib绘制多子图⚓︎
约 7 个字 27 行代码 1 张图片 预计阅读时间不到 1 分钟 总阅读量 次
import matplotlib.pyplot as plt
import numpy as np
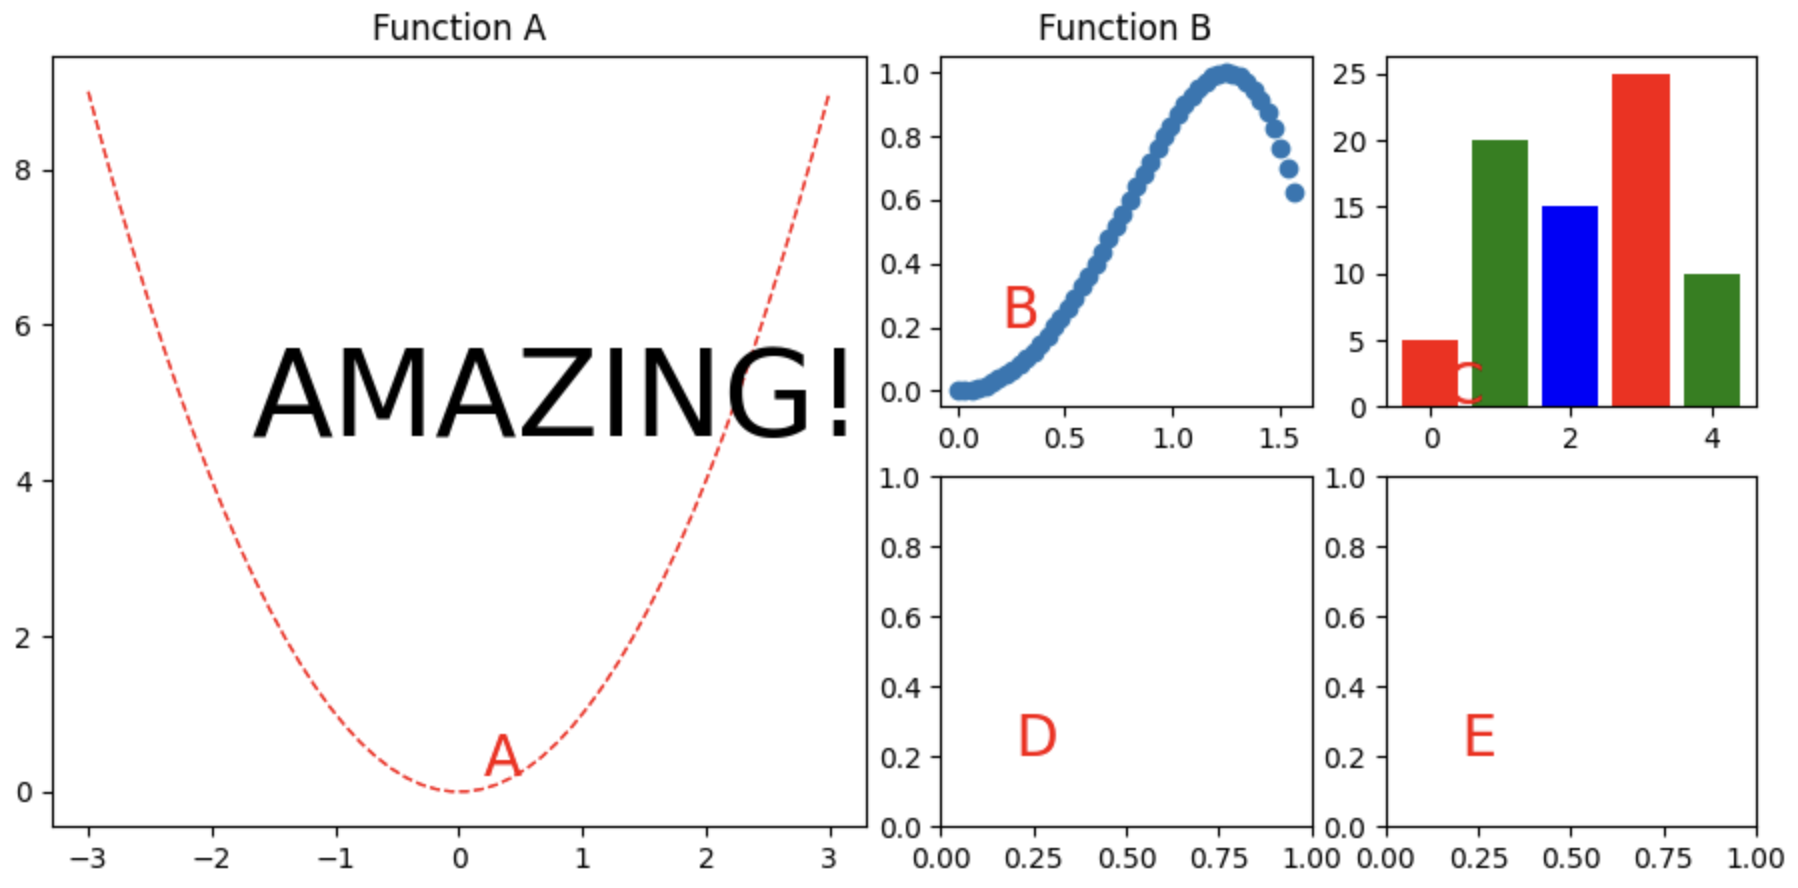
figure_mosaic = """
AABC
AADE
""" # 最终的图片以上述字母的形式分成不同大小的几块
fig, axes = plt.subplot_mosaic(mosaic=figure_mosaic, figsize=(11,5))
x = np.linspace(0, 0.5*np.pi, 50)
y = np.sin(x**2)
for label, ax in axes.items():
ax.text(0.2, 0.2, label, color = "red", size = 20)
axes["A"].text(0.8,5, "AMAZING!", ha = 'center', va = 'center', size = 43)
x1=np.linspace(-3,3,50)
y1=x1**2
axes["A"].plot(x1,y1,color='red',linewidth=1.0,linestyle='--')
axes["A"].set_title('Function A')
axes["B"].set_title('Function B')
axes["B"].scatter(x, y)
data = [5, 20, 15, 25, 10]
axes["C"].bar(range(len(data)), data, color=["r","g", "b"])
fig.savefig("./Show.png")